

Top 50 Breweries in the U.S. in 2023
Jobs, on-premise sales, and the number of operating craft breweries continue to grow

Small and independent craft brewers trade group the Brewers Association announced their 2023 market report revealing the Top 50 Brewing Companies in the United States. Based on the 2023 annual production figures from American craft brewers, the Brewers Association report offered somewhat positive news that somewhat dispels or atleast softens the overall dim outlook that national media has cast over the craft beer industry as a whole over the last few years.
According to the Brewers Association and their chief economist Bart Watson, the number of operating craft breweries continued to climb in 2023, reaching an all-time high of 9,683, including 2,071 microbreweries, 3,467 brewpubs, 3,900 taproom breweries, and 245 regional craft breweries. The total U.S. operating brewery count was 9,812, up from 9,730 in 2022. Throughout the year, there were 495 new brewery openings and 418 closings. Openings decreased for a second consecutive year, with the trend reflecting a more mature market. The closing rate increased in 2023 but continued to remain relatively low, at approximately 4%.
Driven by the growing number of breweries and a continued shift to hospitality-focused business models, craft brewers directly employed 191,421 people in 2023, a 1.1% increase from 2022.
“2023 was another competitive and challenging year for small and independent brewers,” said Bart Watson, vice president of strategy and chief economist of the Brewers Association. “Nevertheless, even as growth has downshifted, small brewers have proved quite resilient, as seen in the increase in number of breweries, relatively low closing rates, and gains in onsite sales and jobs.”
Collectively, small and independent brewers produced 23.4 million barrels of beer in 2023, a decline of 1.0% from 20223, though craft’s overall beer market share by volume grew to 13.3%, up from 13.1% in 2022 as craft’s declines were smaller than overall beer volume losses.
The overall beer market* shrank 5.1% by volume in 2023. Retail dollar value was estimated at $28.6 billion, representing a 24.5% market share and 3% growth over a comparable value in 2022. Sales growth was stronger than volume primarily due to pricing but also due to slightly stronger onsite sales growth versus distribution.
“As always, the beverage alcohol market and consumer demand continue to evolve,” added Watson. ”Many brewers are accordingly updating their operations to match those changes, focusing on their business models, go-to-market strategies, and brand strategies to help their businesses match those shifts.”
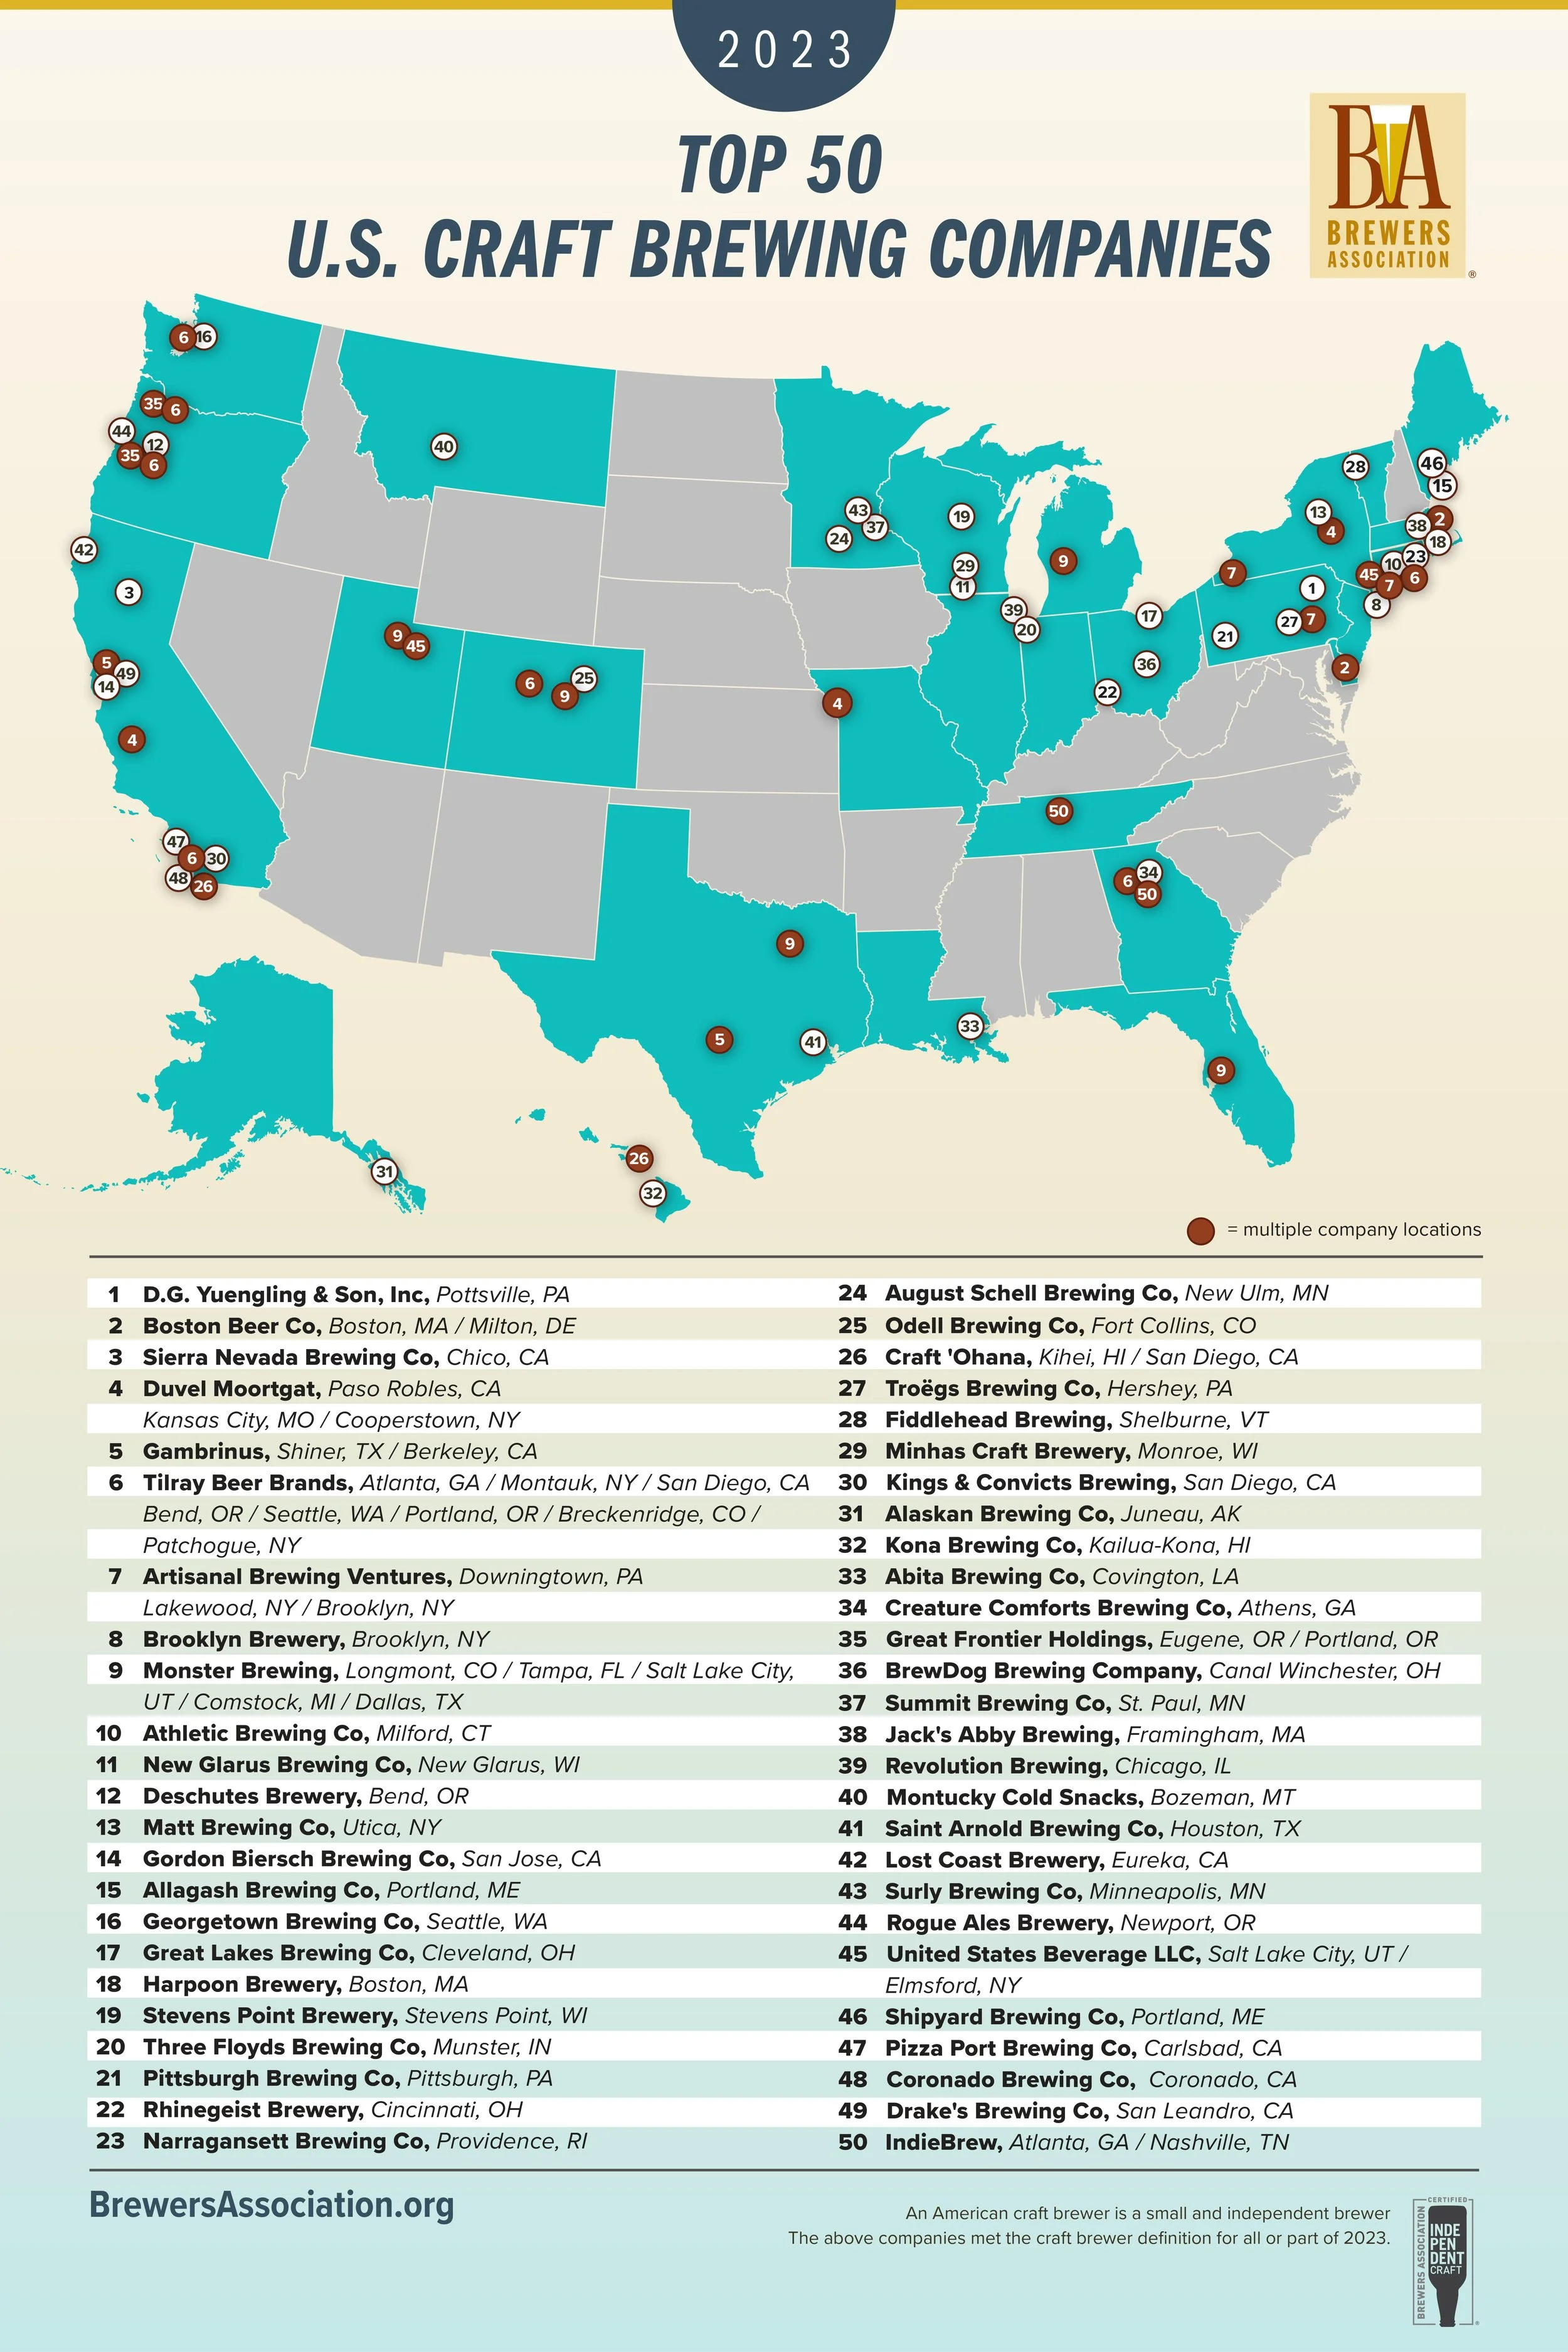
In addition, the Brewers Association also released its annual list of the top 50 producing craft brewing companies and overall brewing companies in the U.S., based on beer sales volume. Of the top 50 overall brewing companies in 2023, 40 were small and independent craft brewing companies.4
“While distribution is as competitive as ever, we continue to see success stories and pockets of growth across the top 50 list,” said Watson. “Even in an era of slow growth, the strongest brands still resonate with beer drinkers, regardless of company size or location.”
* Does not include FMBs/FSBs. With those included, total taxed-as-beer products decreased 5%.
1An American craft brewer is a small and independent brewer. Small: Annual production of 6 million barrels of beer or less (approximately 3% of U.S. annual sales). Beer production is attributed to a brewer according to the rules of alternating proprietorships. Independent: Less than 25% of the craft brewery is owned or controlled (or equivalent economic interest) by a beverage alcohol industry member that is not itself a craft brewer. Brewer: Holds a Brewer’s Notice issued by the Alcohol & Tobacco Tax & Trade Bureau, or its successor, or control the intellectual property for one or more brands of beer, has that brand or brands brewed for it in the United States, and have as its primary business purpose the resale of the brand or brands it controls.
2Absolute figures reflect the dynamic craft brewer data set as specified by the craft brewer definition. Growth numbers are presented on a comparable basis.
3Volume by craft brewers represents total taxable production.
4Figure based on companies that met the craft brewer definition for all or part of 2023.